Analyze State Assessment Summary
Navigation: DataMap > State Assessments > Summary
Note: You can also access this screen by performing a search on the Home screen in the Assessment Search section (see “Search by Assessment” ).
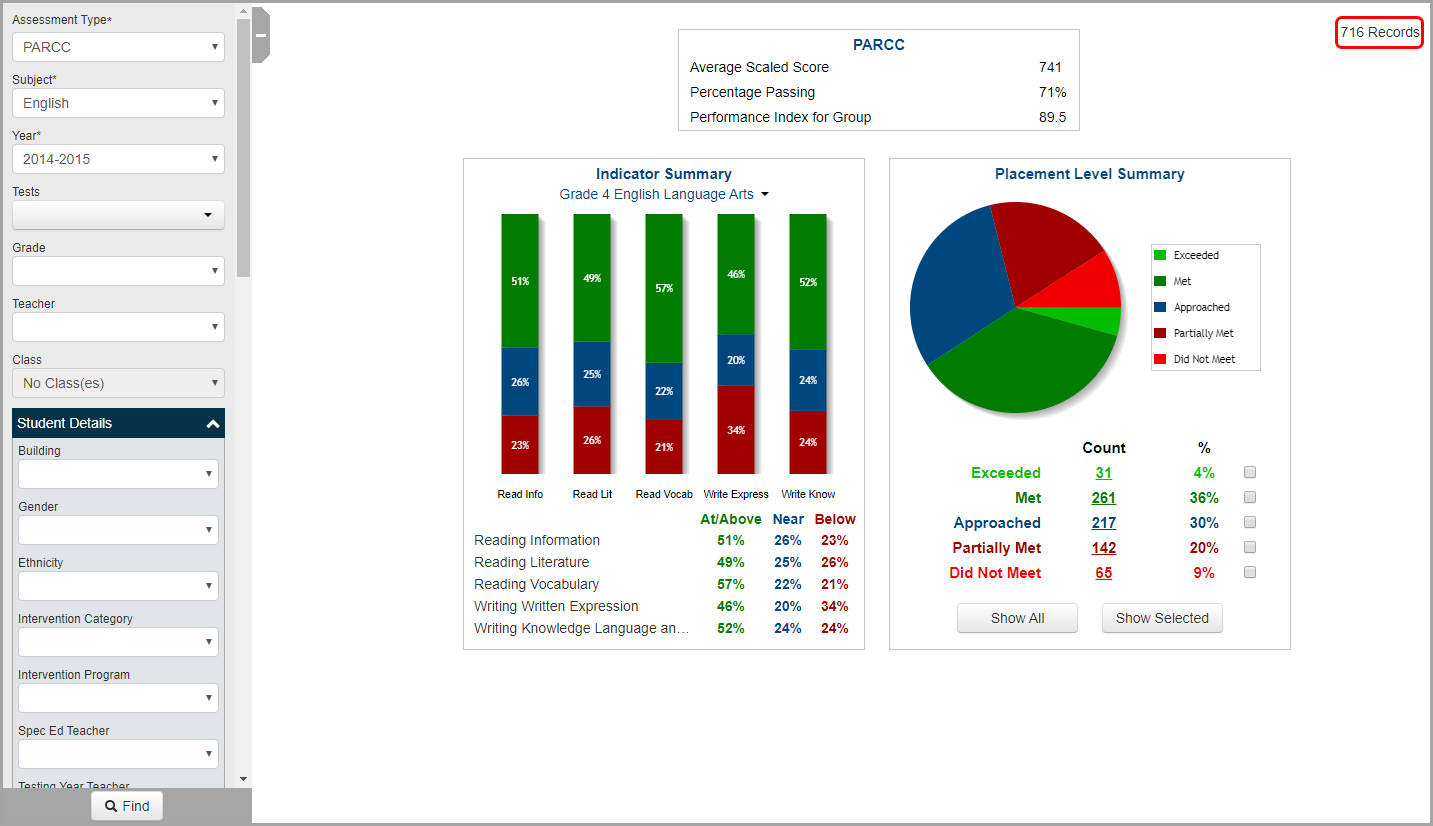
The Summary screen displays student scores based on the values entered in the Assessment Type, Subject, and Year drop-down lists and provides a total number of records on the top-right corner of the screen.
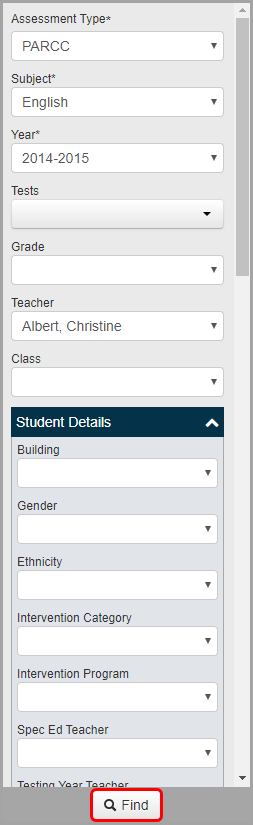
To further narrow your results, in the search panel on the left side of the screen, enter additional search criteria. Then, click Find.
Note: The IEP and 504 Plan drop-down lists filter results based on the Year you select. The Econ Disadvantaged drop-down list filters results based on the school year in context (and displays only if the user role you were assigned in StudentInformation has access to sensitive data).
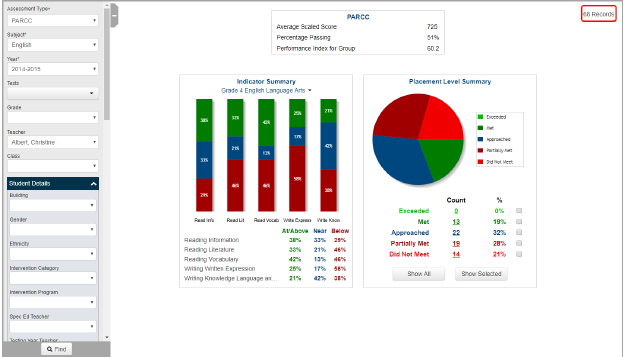
A more refined list of student scores matching your search criteria displays as reflected by the updated record count and changes to the graphs.
Note: If ![]() displays beside the record count, this indicates that the percentage score for the item(s) selected on the left side of the screen has been calculated using the maximum score for the most recent assessment (until the maximum score for the current assessment is available).
displays beside the record count, this indicates that the percentage score for the item(s) selected on the left side of the screen has been calculated using the maximum score for the most recent assessment (until the maximum score for the current assessment is available).
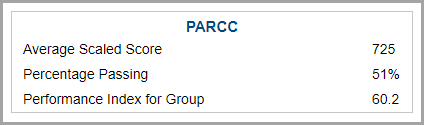
•Assessment Summary (read-only) – Displays the average scaled score, the percentage of students with a passing score, and the performance index for the group
.
Note: The Performance Index for Group is a calculation based on the number of students placed at each level and is reported on the state report card.
•Standards Summary (read-only; available only for OAA and OGT) – Displays the aggregated percentage score for the selected group in each of the content standard areas, a bar graph that illustrates those scores, and the percentage of students in the group with a passing score
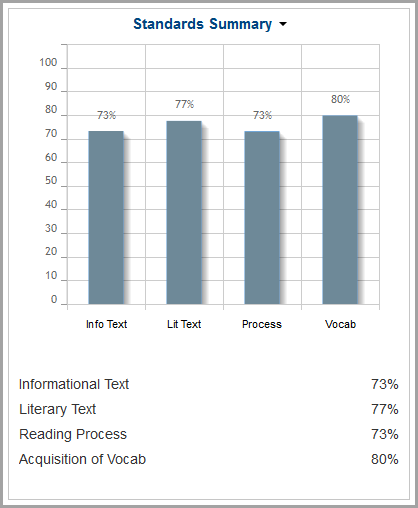
.
Note: To view the Indicator Summary, beside Standards Summary, click ![]() . Then, in the drop-down list that displays, select Indicator Summary.
. Then, in the drop-down list that displays, select Indicator Summary.
•Indicator Summary (read-only) – Displays the distribution of subarea indicator scores for a particular assessment
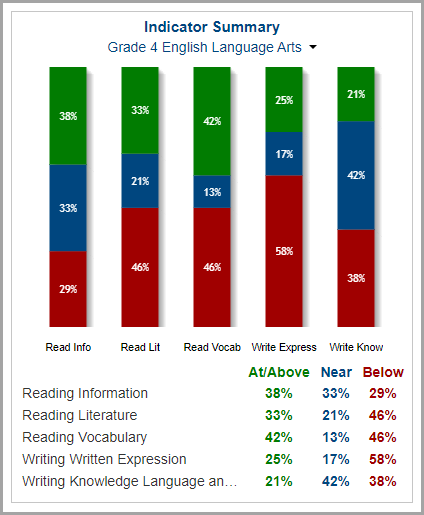
.
Note: To view the Standards Summary (if you are viewing the OAA or OGT assessment), beside Indicator Summary, click ![]() . Then, in the drop-down list that displays, select Standards Summary.
. Then, in the drop-down list that displays, select Standards Summary.
•Placement Level Summary – Displays the ranking of the selected group by Count and percentage (%) of students who scored at each placement level as well as a clickable pie chart that illustrates the placement levels
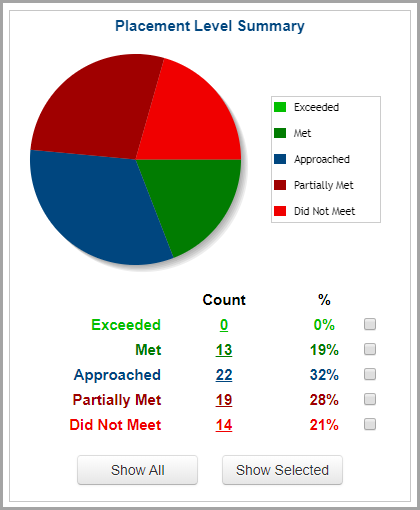
.
To view more details in the Placement Level Summary section, select one of the following options:
•To view details for students at all placement levels, click Show All.
•To view students only at a particular placement level, click the underlined Count value in the row of that placement level. Or, click the section of the pie that represents the placement level.
•To see students at more than one placement level, select the checkboxes in the row of each placement level, then click Show Selected.
Note: To view details of the students included in your selected group, see “Analyze State Assessment Standards.”