Analyze State Assessment Standards
Navigation: DataMap > State Assessments > Standards
Note: You can also access this screen by performing a search on the Home screen in the Assessment Search are (see “Search by Assessment” ).
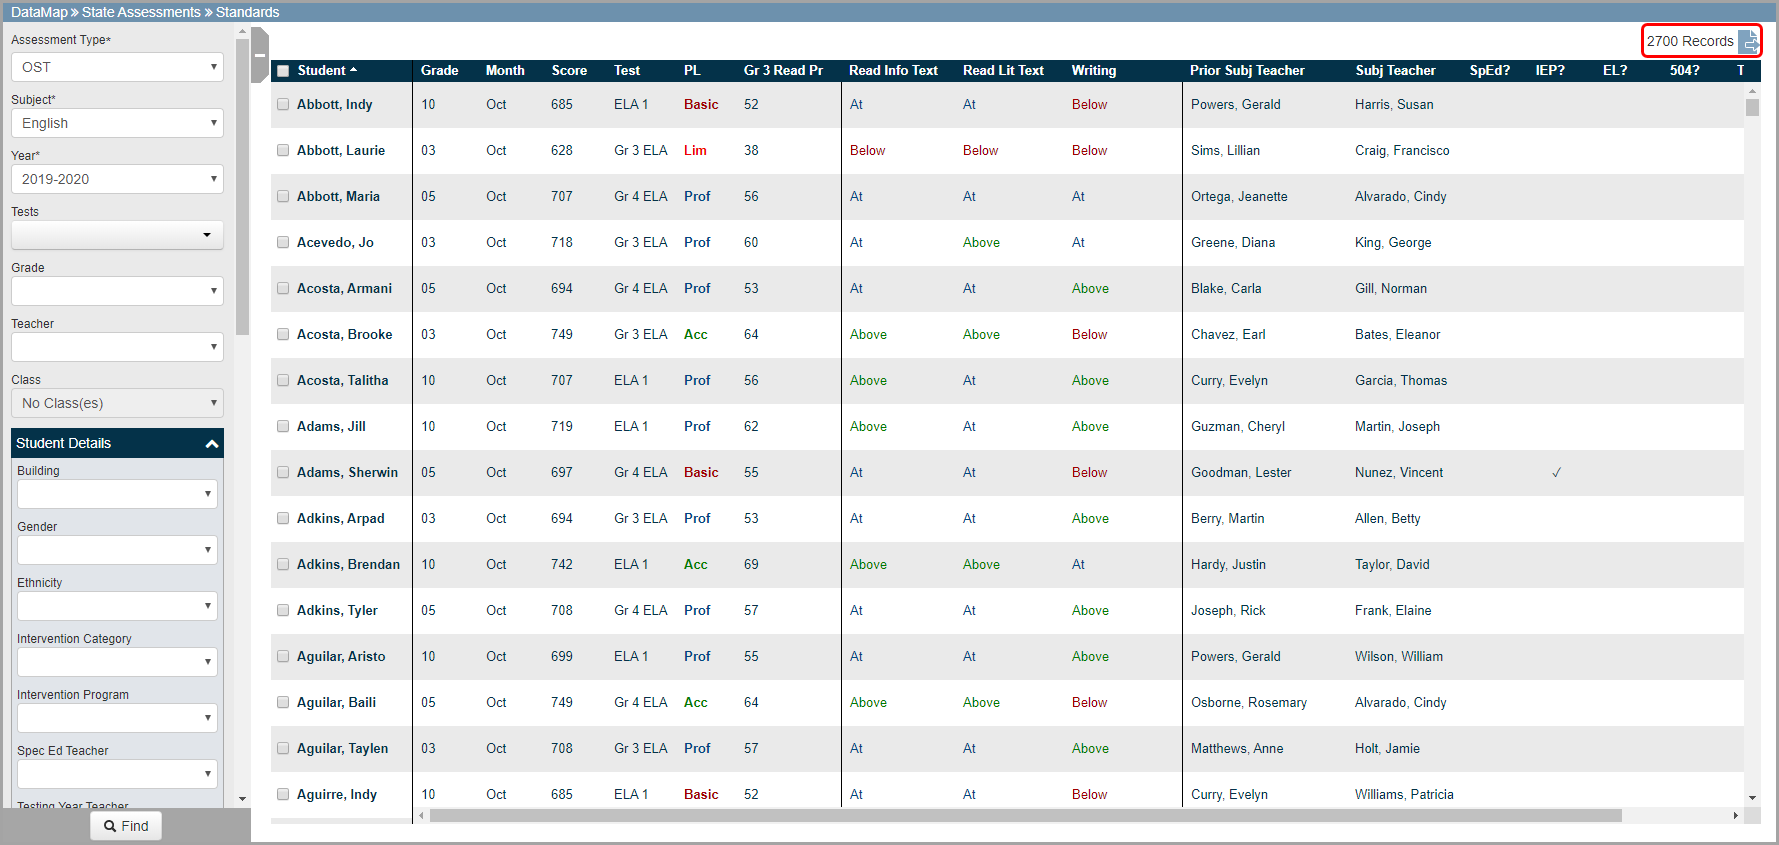
The Standards screen displays student scores based on the values entered in the Assessment Type, Subject, and Year drop-down lists and provides a total number of records on the top-right corner of the screen.
To further narrow your results, in the search panel on the left side of the screen, enter additional search criteria. Then, click Find.
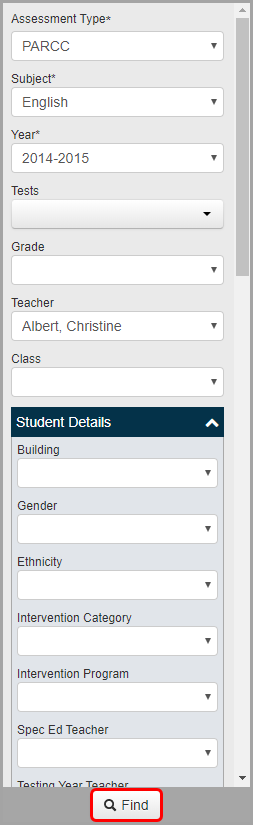
Note: The IEP and 504 Plan drop-down lists filter results based on the Year you select. The Econ Disadvantaged drop-down list filters results based on the school year in context (and displays only if the user role you were assigned in StudentInformation has access to sensitive data).
Note: If you want to view 3rd Grade Reading Promotion scores, in the Assessment Type drop-down list, select OST. Then, in the Subject drop-down list, select English.
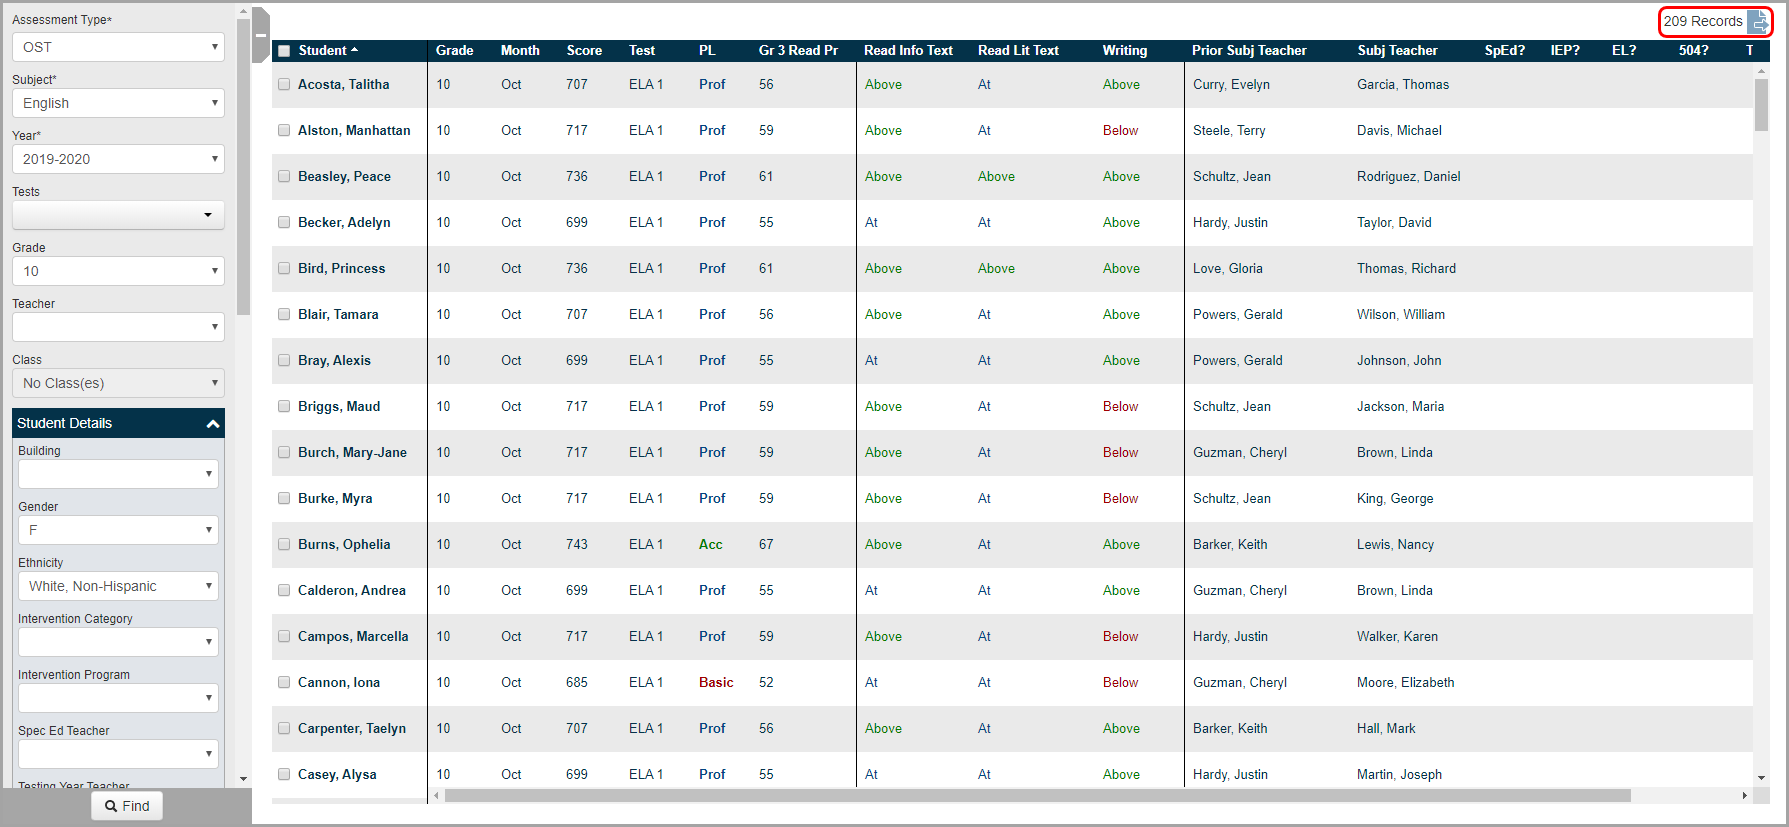
A more refined list of student scores matching your search criteria displays as reflected by the updated record count.
Note: Click ![]() to export your results to a CSV file.
to export your results to a CSV file.
Note: To sort the data by a column, click the column heading.
Overall scores (PL) are color coded based on the placement level in which each score falls. For AASCD, OAA, OST, and OGT, the color codes are as follows:
•Advanced (Adv) – Green
•Accelerated (Acc) – Dark green
•Proficient (Prof) – Blue
•Basic (Basic) – Dark red
•Limited (Lim) – Red
For PARCC, the color codes are:
•Exceeded Expectations (Exceed) – Green
•Met Expectations (Met) – Dark green
•Approached Expectations (Appr) – Blue
•Partially Met Expectations (Partial) – Dark red
•Did Not Yet Meet Expectations (Not Met) – Red
Subarea scores (i.e., percentages achieved in the individual testing areas) are also color coded and include a letter indicator based on the placement level in which each score falls. For AASCD, OAA, OST, and OGT, the color codes are as follows:
•Above Standard (A) – Dark green
•At Standard (P) – Blue
•Below Standard (B) – Dark red
For PARCC, the color codes are:
•At/Above Standard – Dark green
•Near Standard – Blue
•Below Standard – Dark red
Note: If ![]() displays beside a student’s test scores, this indicates that the student’s percentage score has been calculated using the maximum score for the most recent assessment (until the maximum score for the current assessment is available).
displays beside a student’s test scores, this indicates that the student’s percentage score has been calculated using the maximum score for the most recent assessment (until the maximum score for the current assessment is available).
Note: For the PBA (Performance-Based Assessment) and EOY (End-of-Year) columns that display for the OST, a checkmark displays if a student has taken each of these assessments.
Note: If an asterisk (*) displays beside a score, this indicates that the student has taken the assessment multiple times. The score that displays is the highest score.