|
|
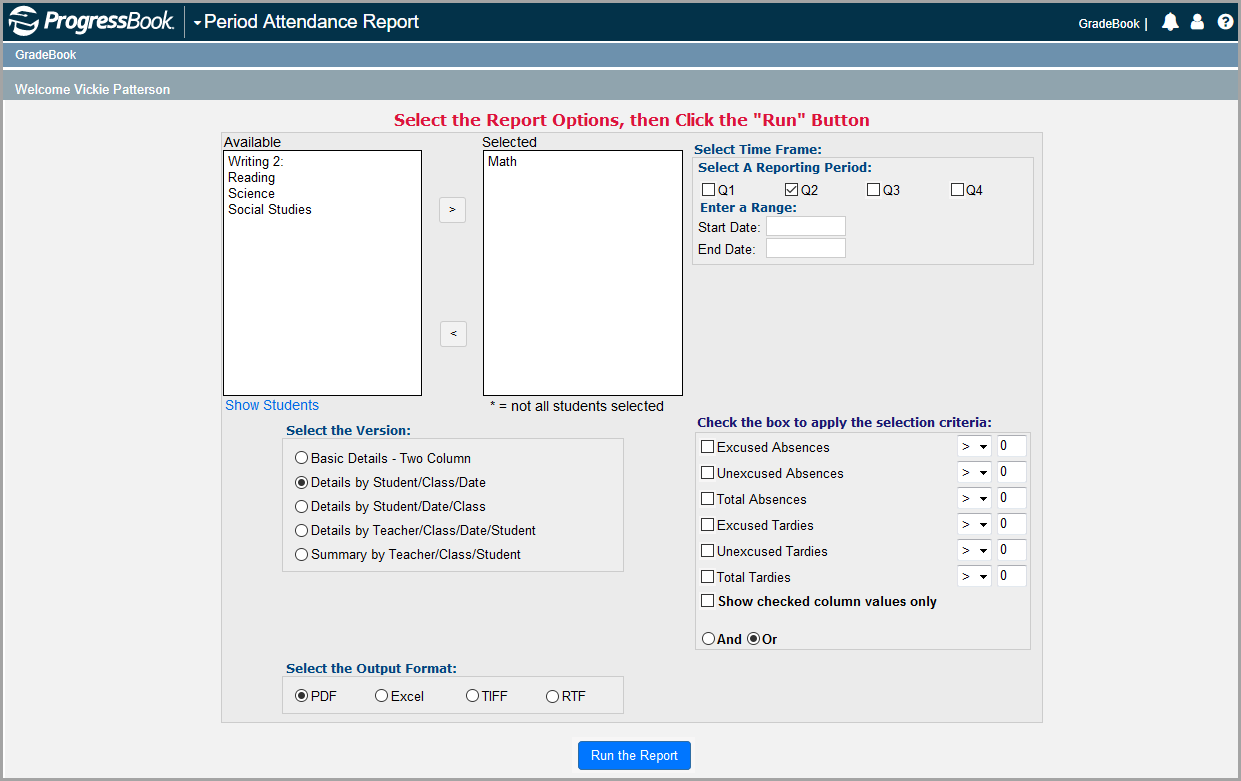
The Period Attendance Report provides teachers with numerous options for presenting summary- and detail-level period attendance data. Three detailed report versions display attendance information using a variety of grouping and filtering combinations. A summary report version displays attendance information by teacher, class, and student. The Basic Details – Two Column report version does not allow filtering.
1.On the Teacher Home Page, in the Select a Report drop-down list, select Period Attendance Report.
2.Click Run.
3.On the Period Attendance Report screen, select the class(es) in the Available column for which you want to run the report.
4.Click > to move the selected classes to the Selected column.
5.Select the appropriate reporting period, or enter dates in the Start Date and End Date fields to span several reporting periods or limit the date range to less than a reporting period.
6.Select one of the following versions:
•Basic Details - Two Column – Displays attendance information in two columns alphabetically by student last name
•Details by Student/Class/Date – Displays attendance information grouped alphabetically by student last name, class, and then date of absence
•Details by Student/Date/Class – Displays attendance information grouped alphabetically by student last name, date of absence, and then class
•Details by Teacher/Class/Date/Student – Displays attendance information grouped by teacher, class, date of absence, and then alphabetically by student last name
•Summary by Teacher/Class/Student – Displays attendance information by teacher, class, and then alphabetically by student last name
7.If you selected any of the report version options except for Basic Details - Two Column in step 6, select one of the following absence type options:
•Excused Absences
•Unexcused Absences
•Total Absences
•Excused Tardies
•Unexcused Tardies
•Total Tardies
•Show checked column values only
•And
•Or
8.If you selected any of the report version options except for Basic Details -- Two Column in step 6, select one of the following inequality options beside an absence type option in step 7, and then enter a number in the blank field beside it:
•>
•<
•=
9.Select one of the following output formats:
•PDF – Portable document file format that cannot be edited; to view the report, you must have Adobe Reader installed
•Excel – Format provides full functionality of Microsoft Excel; to view, edit, or save the report in this format, you must have Excel installed
•TIFF – Large graphic file that may take longer to open than other file types and cannot be edited
•RTF – Formatted document file type that can be edited; to edit the report, you must have word processing software installed
10.Click Run the Report.
Note: If a message displays asking to open or save the file, click Open to view the report. This message may display depending on your browser’s security settings.
11.View the report, and save or print it if desired.
12.Close the report window.
|
|
|
|