Compare Student Performance-Level Scores on State Assessments
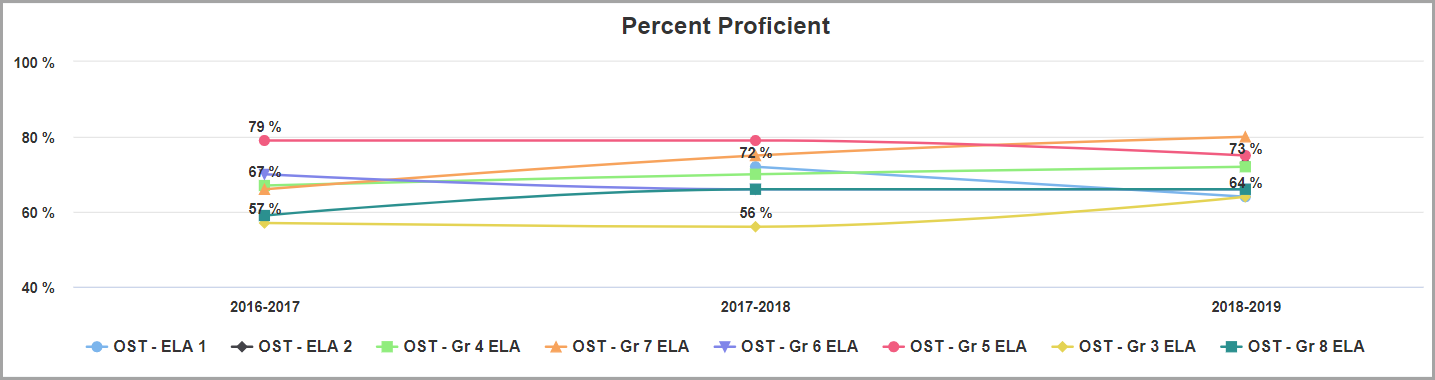
The Percent Proficient line graph displays the percentage of students who received a performance-level score of Proficient or higher for the subject, state assessment(s), school year(s), and state test(s) you select.
1.In the search panel on the left side of the Multiple Measures screen, select a Subject in the drop-down list.
2.In the State Assessments area, in the appropriate multi-select lists, select the checkboxes for the desired Assessment Types, School Years, and state Tests.
3.Click Find.
In the results grid, a list of students matching your search criteria displays.
4.Above the results grid, click ![]() .
.
Note:  displays only if performance-level scores are available for the criteria you selected.
The Percent Proficient line graph expands.
Note: To further narrow the number of students that display in the graph, enter or select additional search criteria in the search panel, and then click Find. The graph updates to reflect the additional search criteria you selected.
Note: To view an individual line more clearly, hover your cursor over the line or over the name of the state test associated with the line. All other lines on the graph fade. To exclude a line, below the graph, click the name of the state test associated with the line. The line no longer displays. (You can click the name of the state test a second time to display the line again.)
In the Percent Proficient graph, each state test you selected displays as a separate line (or as a single point if the test was taken in only one of the selected school years) in a different color. Each point on each line represents the percentage of students who received a performance-level score of Proficient or higher for that particular assessment, state test, and school year. You can hover your cursor over a point on the graph to view the following information:
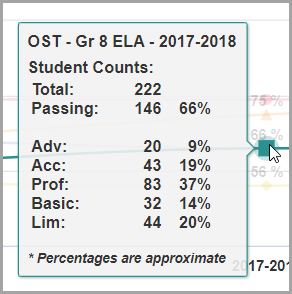
•Name of state assessment
•Name of state test
•School year in which the test was taken
•Total – Total number of student performance-level scores
•Passing – Total number and percentage of students who received a passing performance-level score (Proficient or higher)
•Adv – Total number and percentage of students who received a performance-level scored of Advanced
•Acc – Total number and percentage of students who received a performance-level score of Accelerated
•Prof – Total number and percentage of students who received a performance-level score of Proficient
•Basic – Total number and percentage of students who received a performance-level score of Basic
•Lim – Total number and percentage of students who received a performance-level score of Limited
•Inv – Total number and percentage of invalid performance-level scores and/or students who did not take the selected state test within the selected school year