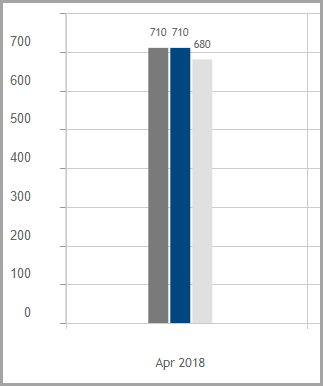
If you did not select a Standard, after you click Find, this type of bar graph displays:

Note: If you selected multiple testing periods, you can use the scrollbar below the bar graph(s) to view more information.
Color Code
•Dark gray – Displays the average scaled score on the selected state assessment for all students in the district.
•Dark blue – Displays the average scaled score on the selected state assessment for all students in the building.
Note: If a student attends/has attended more than 1 building in the same school year or a teacher instructs/has instructed a course at more than 1 building in the same school year, data for each building displays in a different shade of blue.
•Light gray (if you selected a Student) – Displays the student’s individual scaled score on the selected state assessment.
•Light gray (if you selected a Teacher) – Displays the average scaled score on the selected state assessment for all students whom the teacher instructs.
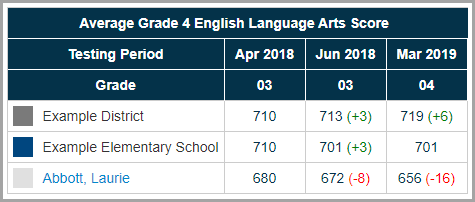
You can also review the information that displays in the grid below the bar graph.

Note: To view details about a particular score in the grid, see “Viewing Score Details.”
•Testing Period – Displays each of the selected testing periods.
•![]() – Indicates that the score has increased since the previous testing period.
– Indicates that the score has increased since the previous testing period.
•![]() – Indicates that the score has decreased since the previous testing period.
– Indicates that the score has decreased since the previous testing period.
Grade
•If you selected Student – Displays the grade level of the student during each of the selected testing periods.
•If you selected Teacher – Displays the grade level that the teacher instructed during each of the selected testing periods (shown above).
Color Code
•Dark gray – Displays the average scaled score on the selected state assessment for all students in the district for each of the selected testing periods.
•Dark blue – Displays the average scaled score on the selected state assessment for all students in the building for each of the selected testing periods.
Note: If a student attends/has attended more than 1 building in the same school year or a teacher instructs/has instructed a course at more than 1 building in the same school year, data for each building displays in a different shade of blue.
•Light gray (if you selected a Student) – Displays the student’s individual scaled score on the selected state assessment for each of the selected periods.
•Light gray (if you selected a Teacher) – Displays the average scaled score on the selected state assessment for all students that the teacher instructs for each of the selected testing periods.